

The Google Ads Auction Insights report lets you compare your ads to other ads that are competing in the auctions you’re bidding. Offers 6 metrics: impression share, overlap rate, position above rate, top of page rate, absolute top of page rate, and outranking share – but not the keywords, bids or budgets of competitors.
If you run live ad accounts, you eventually face questions about competitor visibility. The auction environment is intentionally opaque. You do not need to guess who bids against you or why your lead volume dropped. The native report exists specifically to demystify your competitive landscape.
When you look at this data for the first time, the sheer volume of percentages and domain names causes confusion. A high competitor top-of-page rate does not automatically mean you must increase your own bids. You have to know exactly how to interpret the numbers to make strategic adjustments to your campaigns. This guide takes you through each step of the report as a senior media buyer does, and tells you what to watch for and what to ignore — as well as how we use this data on live accounts.
What the Auction Insights report shows
Auction Insights is a diagnostic report that compares your ads to other ads in the same auctions. If two or more advertisers bid for the same keywords at a given time, they are bidding in the same auction. This report reveals what happens in that space. It displays the amount of time you are ranked higher than rivals, how often you show up next to them, and the percentage of the impressions that you can grab. These benchmarks indicate if you’re outcompeting your core search area or if competitive forces are taking over. Instead of guessing why acquisition costs shifted, the report provides exact context, making it the definitive starting point for competitive research.
How to open Auction Insights (campaign, ad group, keyword level)
You are able to view the report at three different levels: campaign level, ad group level, and keyword level. The campaign level is used for general executive summaries, the ad group level is used for theme based competitive analysis, and the keyword level is used for tactical bidding decisions for your highest value keywords.
Follow these three steps to open the report and view only the data that you want to see.
- Open your Google Ads account, click on your Google Ads left-hand menu, and choose your Campaigns, Ad groups, or Search Keywords tab.
- Check the empty boxes to determine which rows are to be analyzed.
- Locate the Auction insights option down the blue horizontal bar at the top of the data table.
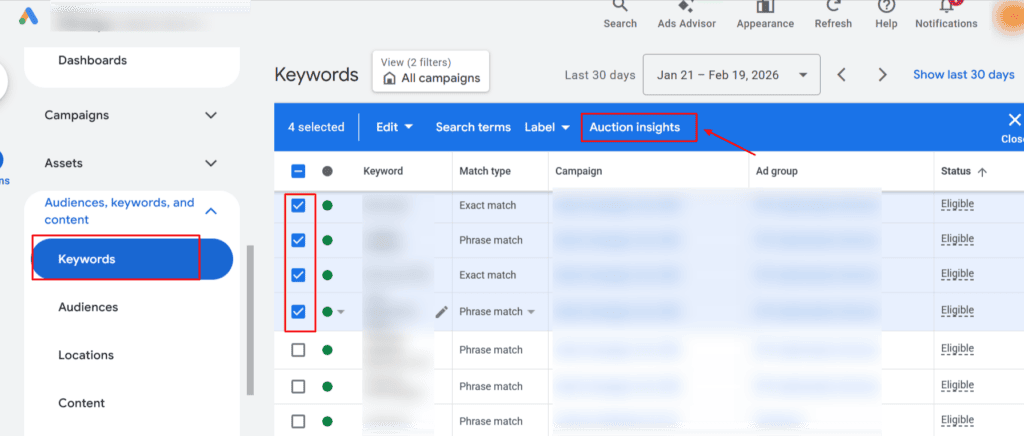
Select your desired rows first, then click “Auction insights” in the top menu to view competitor data for those specific targets.
Do not simply view the report for your entire account at once. Account-level data blends your branded search terms (where you have a 99% impression share) with your competitive non-brand terms, creating a skewed, unreadable average. Always select specific, related rows before generating the data.
The six metrics – what each means and what to do about it
The report provides six core metrics. Each metric serves a distinct diagnostic purpose.
| Metric | Definition | The decision it drives |
| Impression share | The percentage of impressions you received divided by the estimated number of impressions you were eligible to receive. | Fix your budget or fix your Ad Rank. |
| Overlap rate | How often another advertiser received an impression in the same auction that your ad also received an impression. | Identify your most direct, persistent competitors. |
| Position above rate | How often a competitor’s ad showed in a higher position than yours, when both of your ads were shown at the same time. | Raise bids or make ads more relevant to outbid a particular competitor. |
| Top of page rate | The number of times your ad (or competitor’s ad) showed up in the top of the search results. | Evaluate whether you should raise your bids to get attention. |
| Absolute top of page rate | How often your ad appeared as the very first ad above the organic search results. | Decide if the premium cost of holding the #1 spot is worth the return. |
| Outranking share | How often your ad ranked higher than a competitor’s ad, or showed when theirs did not. | Measure your overall dominance over a specific competing domain. |
Impression share
Impression share is the percentage of eligible impressions your ad actually received. It is calculated by dividing your accrued impressions by total eligible impressions. When this metric drops, you are losing auctions. If lost to budget, add daily funding. If lost to rank, improve your Ad Rank. In the Lebanese market, where budgets run tight, lowering bids slightly can buy more clicks and ultimately raise your impression share.
Overlap rate
Overlap rate reveals how often another advertiser received an impression in the exact same auction as you. It identifies your most direct threat. In accounts we run for UAE service businesses, massive overlap rates often occur during peak retail periods like the Dubai Shopping Festival. When foreign competitors enter and drive overlap above 80%, their promotional changes directly impact your conversion rates, requiring close monitoring.
Position above rate
Position above rate shows how often a competitor’s ad appeared in a higher position than yours during shared auctions. If a competitor has a 90% position above rate, they are aggressively bidding to secure top slots. However, holding the top slot is expensive. If your current, lower position yields a profitable return on ad spend, you do not need to artificially inflate your bids just to beat them.
Top of page rate and Absolute top of page rate
Top of page rate shows how often your ad appeared above the organic search results, while absolute top of page rate tracks appearances in the exact first slot. These metrics help determine if the premium cost of holding the number one position is worthwhile. The absolute top spot costs significantly more. If your conversion rate remains stable in position two, let competitors pay that premium.
Outranking share
Outranking share measures how often your ad ranked higher than a competitor’s ad, or showed when theirs did not. It is the ultimate metric for measuring dominance. If someone asks you whether you are doing a particular opponent, check here. A 75% share rate indicates that you were found above them in three out of four searches or you earned an impression in three out of four searches, while they didn’t get any impression at all.
A real report, read end to end
To understand how this data translates into real account action, you need to see how a media buyer reads the relationships between these metrics. It is never about looking at one percentage in isolation.
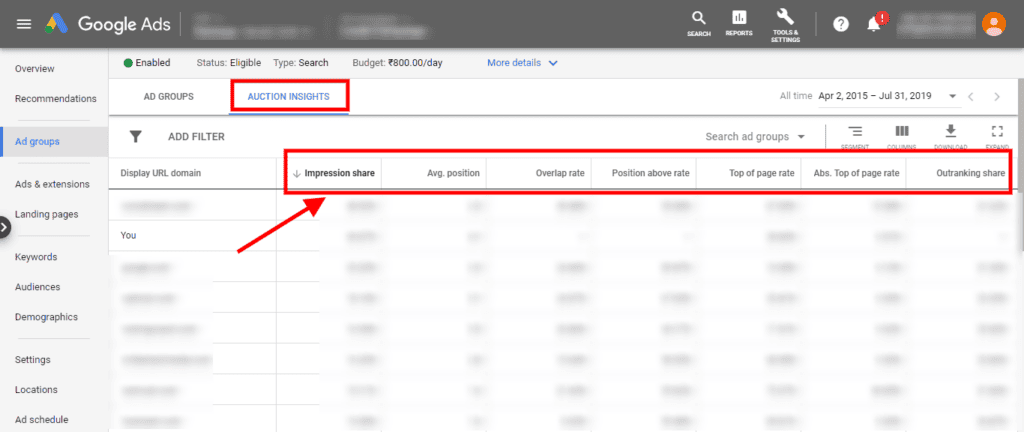
A real-world view of an Auction Insights report showing strong overlap but low position-above rate for a primary competitor.
When you open the report, you immediately scan for the domains you recognize. In this account, our overlap rate with Competitor A is 68%, but their position-above rate is only 12%, so we share the auction constantly yet still win placement. That tells us to hold bids, not raise them. We are already dominating them in the auctions that matter, and raising bids would only waste budget without yielding better visibility.
However, scanning further down the report reveals a different threat. Competitor B has an overlap rate of only 25%, but a staggering position-above rate of 85%. This indicates they are running on a much smaller daily budget or a highly restricted ad schedule compared to us. But when they do enter the auction, their bid and Ad Rank are significantly higher than ours.
If Competitor B ever secures a larger marketing budget, they will become an immediate threat to our outranking share. We do not need to react today, but this tells you exactly who to monitor.

Diagnosing the root cause of lost visibility and deciding on your next optimization steps.
What Auction Insights cannot tell you
The report is incredibly helpful for knowing where you stand in relation to others on the SERP, but is very limited. Google heavily protects advertiser privacy. Because of this, the report never reveals a competitor’s internal, proprietary account data.
The report explicitly cannot tell you:
- What exact match types or keywords your competitors are bidding on.
- How much they are paying per click.
- What their daily or monthly campaign budgets are.
- Their internal Quality Score and cost per acquisition.
A common mistake that many junior buyers make is that when a competitor has a 90% top of page rate, they think they can spend as much money as they like. This is not always the case; sometimes they’re just competing with a very narrow and specific selection of keywords.
This native interface is insufficient if you’re looking for more intelligence, like exact ad copy variations, historical landing pages, or estimated ad spend. You will need to explore free and paid tools to research competitor ads to piece together the rest of their external strategy. Ultimately, combining your own first-party auction data with third-party external tools is how you comprehensively check what competitors are doing on Google Ads.
How often should you check Auction Insights?
You should check the report monthly to monitor long-term trends, or immediately following any major bid, budget, or strategy change in your account.
Checking the report daily yields volatile, fragmented data that lacks statistical significance. Search behavior changes by the day of the week, and daily fluctuations cause reactive, poor bidding decisions. By having a fixed monthly routine, you can identify the competition that is being aggressive about taking market share from you in the past and before they do it again.
Also, if there is a sudden and unexpected increase in average cost per click, click on the key word level report right away. Almost always a CPC spike indicates that a new competitor has appeared in your most valuable shared auction and is actively bidding to raise the minimum bid to get top of page.
FAQ‘s
What is the Auction Insights report?
It is a native Google Ads report which compares your ads performance with other advertisers that are bidding for the same ads, and displays your rank relative to them.
How do I open it?
Choose one or more rows in your Campaigns, Ad groups, or Keywords tab, and then click the “Auction insights” button in the blue horizontal toolbar.
What does overlap rate mean?
It indicates how often another advertiser received an impression in the exact same auction that your ad also received an impression.
Can Auction Insights show competitor keywords or bids?
No, the report never reveals competitors’ actual keywords, bids, Quality Scores, or campaign budgets due to privacy restrictions.
What is a good impression share?
It is highly context-dependent based on your brand. However, a low share flagged as “lost to rank” means you must fix your Ad Rank, while “lost to budget” means you must add funding.
How often should I check the report?
You should review it monthly to establish a trend baseline, or immediately after you execute any major bid or budget changes.